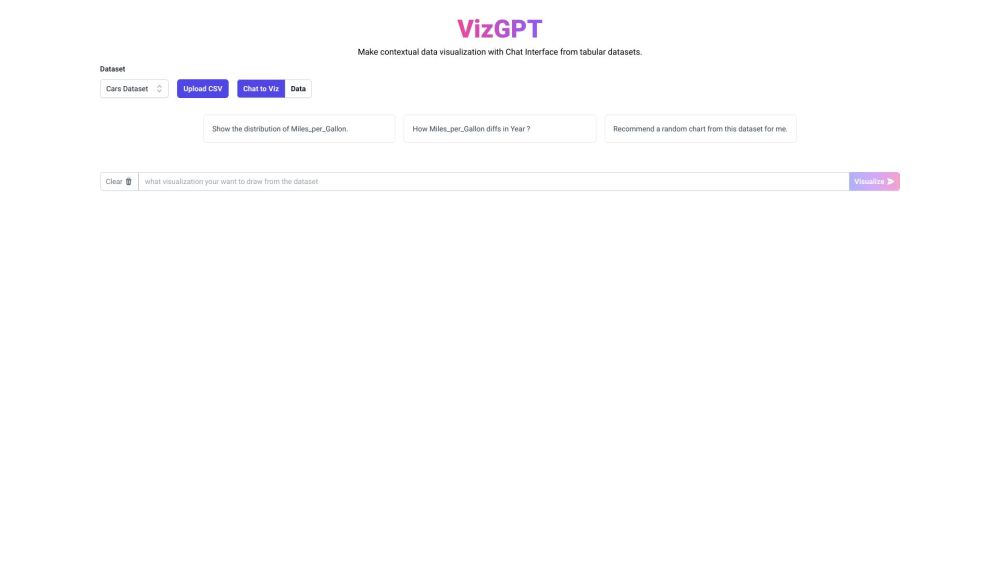
vizGPT: Data Visualization, Chat Interface, Contextual Charts
VizGPT is a data visualization platform with a chat interface, designed to transform contextual data into interactive visual charts. It leverages advanced models such as chartGPT, vizGPT, text2viz, and text2chart to generate meaningful visual representations from textual input.


Understanding VizGPT
VizGPT is an innovative platform designed for data visualization, utilizing a chat-based interface to convert textual data into dynamic visual charts. The platform employs advanced technologies like chartGPT, vizGPT, text2viz, and text2chart, making it easy to generate informative visualizations from textual information.
Getting Started with VizGPT
Key Features of VizGPT
VizGPT offers several standout features, including: - Natural language data visualization capabilities - Generation of interactive visual charts using sophisticated models - Options to customize chart types, dimensions, colors, and labels - User-friendly chat interface for seamless interaction - Real-time updates and adjustments to visualizations during conversations
Applications of VizGPT
VizGPT is versatile and can be used in various contexts, such as: - Visualizing data from business analytics reports - Creating graphical representations of survey data - Analyzing trends and patterns in social media content - Translating research findings into visual formats - Supporting decision-making processes with visual insights
Customer Support & Contact Information
For customer service, contact VizGPT support via email: [email protected].
Company Information
VizGPT is developed by Kanaries Data, Inc.
Login to VizGPT
Access the VizGPT login page here: https://vizgpt.ai/signin
Pricing Information
For details on VizGPT pricing, visit: https://vizgpt.ai/pricing
VizGPT on GitHub
Explore the VizGPT project on GitHub: https://github.com/Kanaries
Frequently Asked Questions
What is VizGPT?
VizGPT is a data visualization tool with a chat interface, designed to convert textual data into interactive visual charts using advanced models like chartGPT, vizGPT, text2viz, and text2chart.
How does one use VizGPT?
Simply input your data into the chat interface and engage in a conversation with VizGPT. The platform will interpret the text and generate interactive visualizations, which can be customized by specifying chart types, dimensions, colors, and labels.
What types of visualizations can VizGPT create?
VizGPT can generate a variety of visualizations, including bar charts, line charts, pie charts, and scatter plots. The type of visualization depends on the data and the insights you wish to present.
Is customization of visual charts possible with VizGPT?
Yes, VizGPT allows extensive customization of visual charts, enabling users to adjust dimensions, colors, and labels to meet specific requirements.
Does VizGPT support real-time visualization?
Yes, VizGPT provides real-time updates to visualizations. As new data is added or conversations progress, the charts automatically adjust to reflect the most current information.
What kinds of data can be visualized using VizGPT?
VizGPT can handle various data types, including numerical, categorical, and textual data, transforming contextual information into meaningful visual representations.
Can VizGPT manage large datasets?
VizGPT is designed to handle datasets of varying sizes, from small to large, though performance may vary with the complexity and volume of data.