Understanding VizGPT
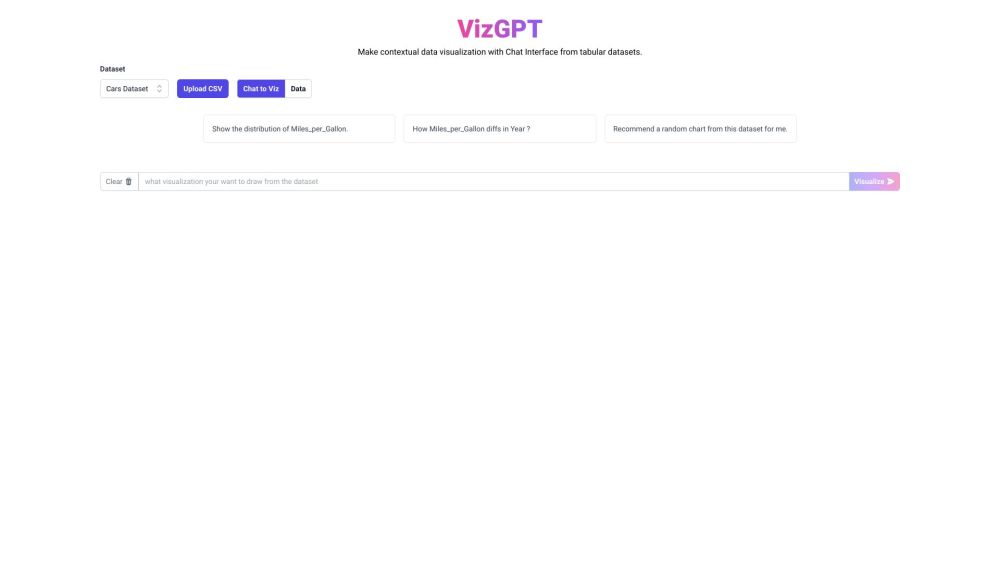
VizGPT is an innovative platform designed for data visualization, utilizing a chat-based interface to convert textual data into dynamic visual charts. The platform employs advanced technologies like chartGPT, vizGPT, text2viz, and text2chart, making it easy to generate informative visualizations from textual information.
Getting Started with VizGPT
To begin using VizGPT, enter your data into the chat interface and initiate a conversation. The system will analyze your input and create interactive visual charts based on the information provided. You can refine these visualizations by specifying the type of chart, dimensions, colors, and labels according to your preferences.