
D&AVIZ: AI marvel transforming raw data into vibrant visuals. Elevate insights with stunning, intuitive visuals effortlessly. Unleash the power of your data!
Explore a specific workflow
Explore graphs tools through the product profiles below. The collection groups applications around a shared task. Product scope can overlap, so compare the specific workflow each tool describes rather than the category name alone.
Identify the files, text or account connections your task needs. Confirm that the product accepts those inputs and offers controls for reviewing its work.
Test one representative task and inspect the result for accuracy and completeness. Record where manual corrections or extra tools are needed.
D&AVIZ: AI marvel transforming raw data into vibrant visuals. Elevate insights with stunning, intuitive visuals effortlessly. Unleash the power of your data!

Unlock insights effortlessly with Lychee: a streamlined data analysis and visualization tool that simplifies your data without complex spreadsheets.

Aimbly: Streamline meetings with automated insights, transcripts, and secure data—turn chaos into productivity effortlessly.
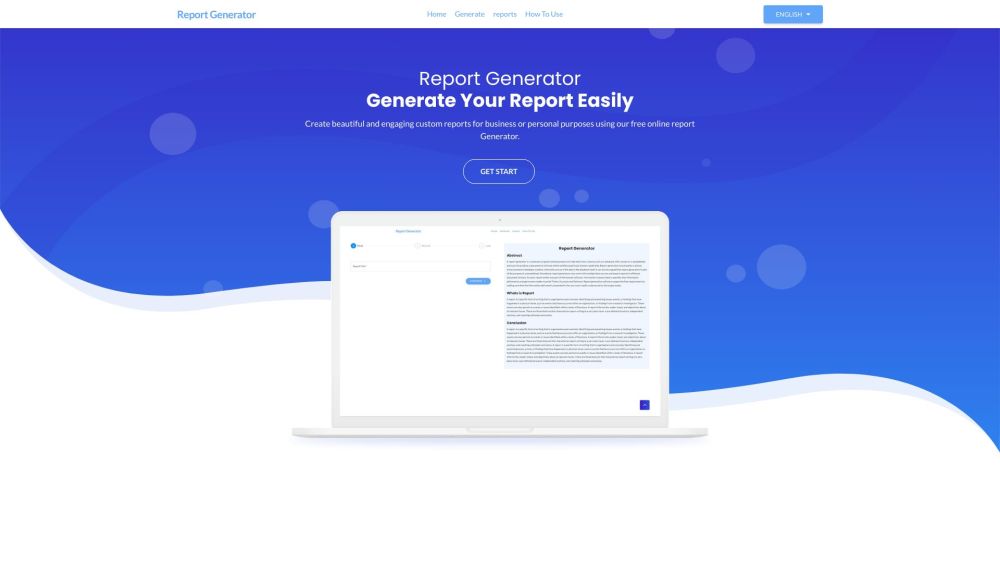
Generate quick, professional reports & graphs effortlessly with Report Generator. Transform data into visually appealing, informative reports in minutes!
FAQ
Practical answers to help you take the next step.
The collection groups applications around a shared task. Product scope can overlap, so compare the specific workflow each tool describes rather than the category name alone.
Identify the files, text or account connections your task needs. Confirm that the product accepts those inputs and offers controls for reviewing its work.
Test one representative task and inspect the result for accuracy and completeness. Record where manual corrections or extra tools are needed.
Choose one task with a clear success condition. Keep the input consistent, record the time spent reviewing and compare the complete workflow cost.
D&AVIZ: AI marvel transforming raw data into vibrant visuals. Elevate insights with stunning, intuitive visuals effortlessly. Unleash the power of your data!
Read about D&AVIZUnlock insights effortlessly with Lychee: a streamlined data analysis and visualization tool that simplifies your data without complex spreadsheets.
Read about LycheeAimbly: Streamline meetings with automated insights, transcripts, and secure data—turn chaos into productivity effortlessly.
Read about AimblyGenerate quick, professional reports & graphs effortlessly with Report Generator. Transform data into visually appealing, informative reports in minutes!
Read about Report GeneratorCheck export formats, integrations and whether you can keep using your work outside the service. Test a real export before committing to a longer plan.
Run the same small task in each shortlisted product. Compare the price per usable result, usage limits, regeneration costs and time spent correcting the output. Confirm current terms with the provider.