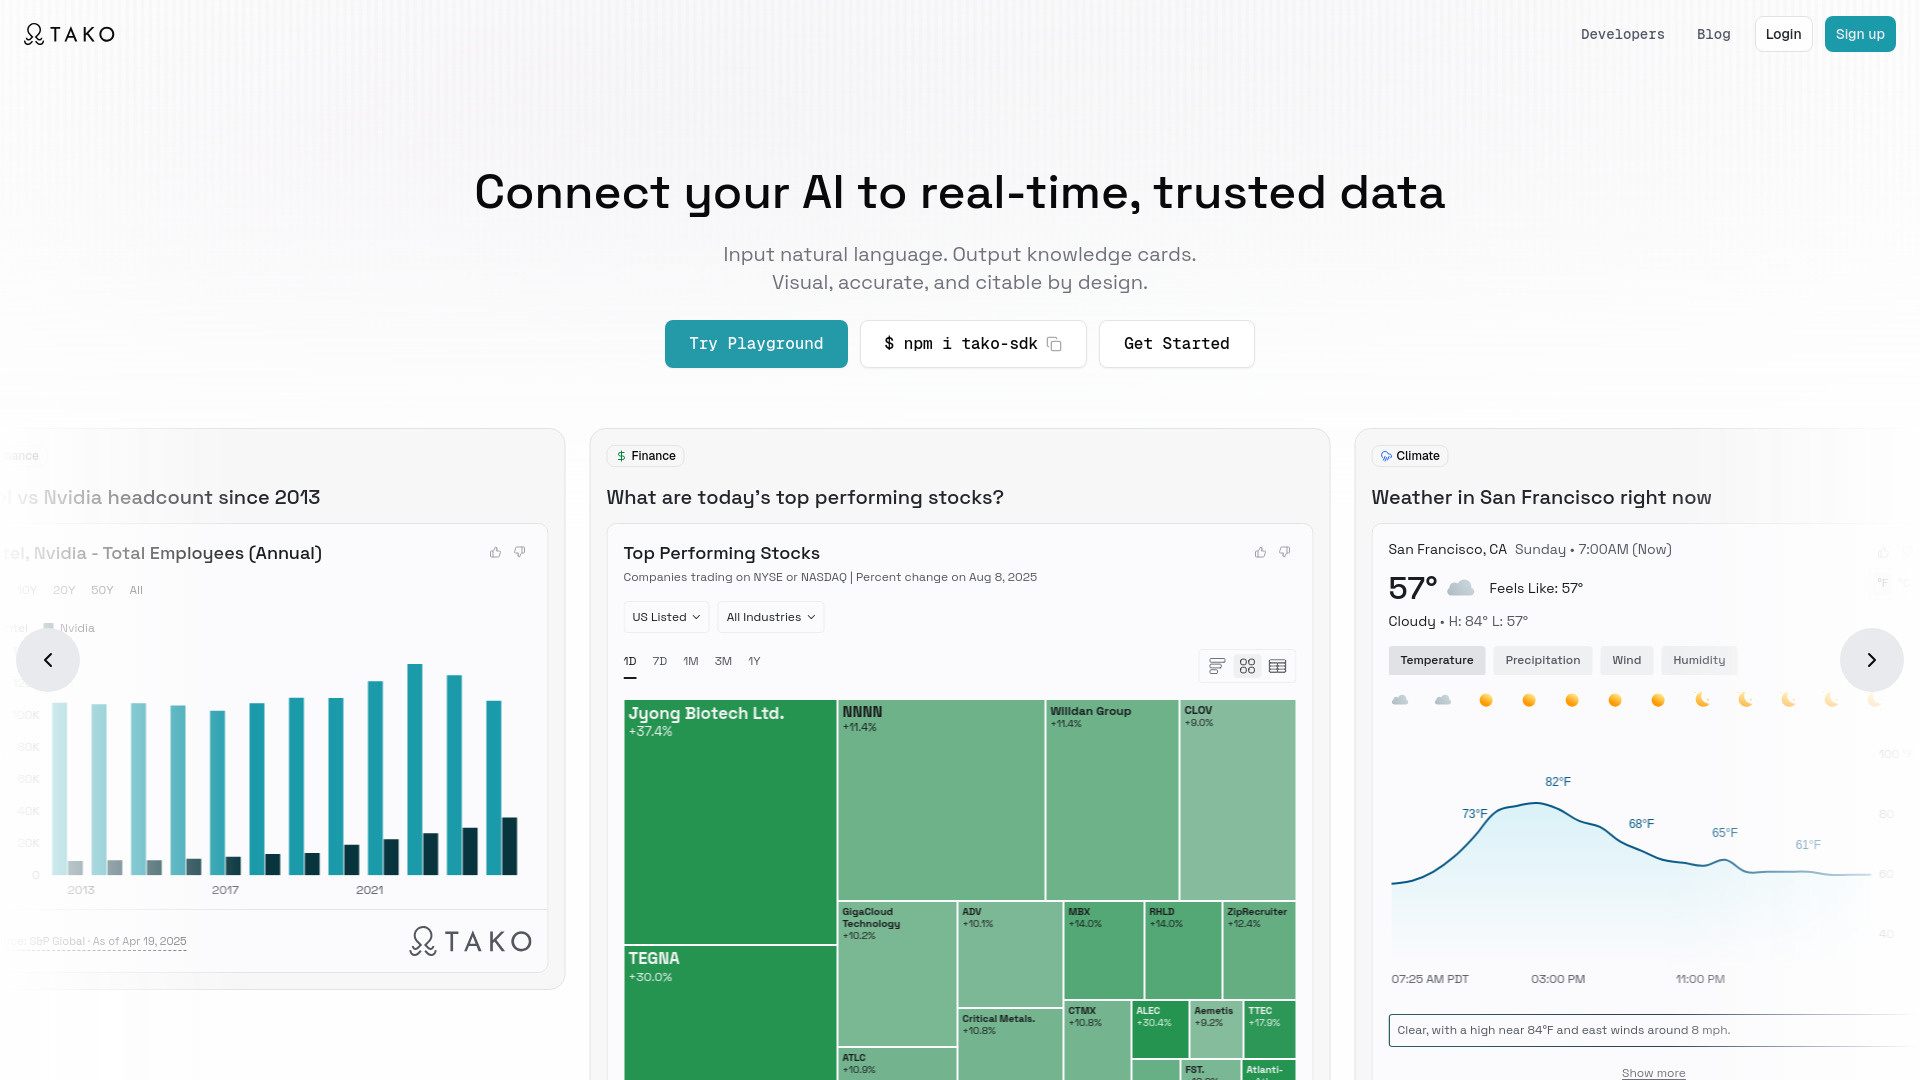
What is Tako?
Tako is an AI data visualization platform that helps applications, agents, and users turn questions into visual answers. By connecting natural language requests with relevant data, it presents information through interactive knowledge cards that users can explore, cite, and share. These cards bring together visual context and supporting sources, making complex topics easier to understand. Tako also offers a Connect API for incorporating data analysis and visualization into digital products, from research assistants and AI search tools to business intelligence workflows.
At the center of Tako is a practical goal: making useful information easier to find and communicate. Its semantic search capabilities help interpret what users mean, while its visualization tools turn retrieved information or uploaded datasets into accessible insights. This combination supports both people exploring data directly and developers building applications that deliver richer answers.
How to Use Tako
Start with a question written in everyday language. Tako interprets the request and uses relevant data to generate a visual response, helping you explore a subject without writing a database query. Interactive knowledge cards provide a way to review findings, examine context, and share information with others. The quality and scope of an answer depend on the data available for the request.
For analysis through Tako Connect, begin by supplying a supported dataset, such as an XLSX spreadsheet or CSV file. Next, explain your objective in plain language—for example, identifying sales trends, comparing performance across categories, or understanding changes over time. Tako then uses that direction to produce visualizations and related insights. Developers can incorporate these capabilities into existing applications through APIs, supporting workflows that connect data exploration with user-facing answers.
Key Features of Tako
- Interactive Knowledge Cards: Present information in visual cards that combine data, context, and citations, giving users a practical way to explore findings and share supporting evidence.
- Natural Language and Semantic Search: Ask questions using familiar language and retrieve information based on meaning and context, reducing the need to construct technical queries.
- Customizable Data Visualizations: Turn datasets into clear visual summaries that help communicate comparisons, patterns, and trends while supporting different presentation needs.
- Connect API for Developers: Bring Tako's analysis and visualization capabilities into applications, research tools, and automated workflows through a programmable interface.
- AI-Focused Knowledge Graph: Connect related information across data sources to support relevant retrieval and responsive exploration within AI-powered experiences.
Why Choose Tako?
Tako brings data discovery and visual communication into a connected workflow. Teams can move from a written question to an answer supported by charts, contextual information, and source references. This approach is useful when an audience needs to understand both a finding and the evidence behind it. Interactive cards also make information easier to explore during research, presentations, and collaborative discussions.
For developers, Tako provides a way to add visual data experiences to products that already use conversational interfaces or AI-generated responses. For analysts and business users, natural language interaction can simplify the first stages of exploring a dataset. Its emphasis on citable information supports source checking, while customizable visualizations help teams present findings in a form suited to their audience. Organizations with specific security or compliance requirements should review Tako's current documentation when evaluating the platform.
Use Cases and Applications
Research assistants and conversational applications can use Tako to supplement written responses with visual evidence. A question about a trend or comparison can become an interactive knowledge card, allowing users to examine the underlying information more closely. AI search products can similarly incorporate visual answers that provide context and citations alongside concise explanations.
Content creators and publishers can use knowledge cards to make data-heavy material more approachable. Charts and interactive summaries help readers follow numerical comparisons and understand how evidence supports a story. Business intelligence teams can explore uploaded datasets, investigate performance changes, and prepare findings for colleagues. Analysts can also use natural language requests to guide exploratory work, helping stakeholders participate in data discussions without needing to write code.