What is Chartify?
Chartify is an innovative AI-powered tool designed to transform CSV files and database tables into dynamic, customizable charts and graphs. Leveraging AI technology, it provides suggested visualizations and supports user requests for specific chart types, offering a fresh approach to data visualization.
How to use Chartify?
To utilize Chartify, follow these simple steps:
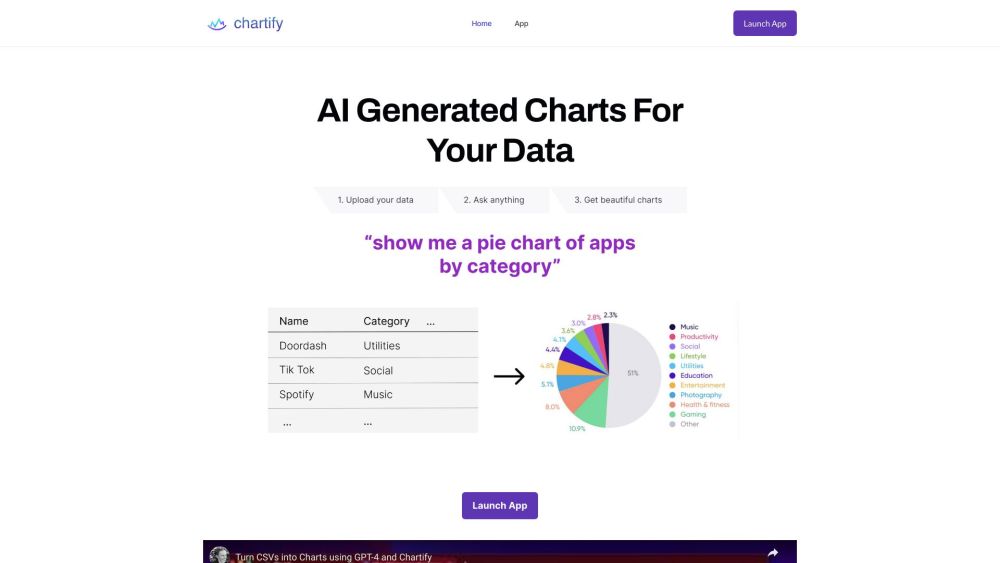
- Upload your data by either adding a CSV file or connecting to a Postgres or MySQL database.
- Receive AI-generated visualization suggestions tailored to your dataset.
- Request specific charts, such as a stacked bar chart displaying revenue growth by product line over the last two decades.