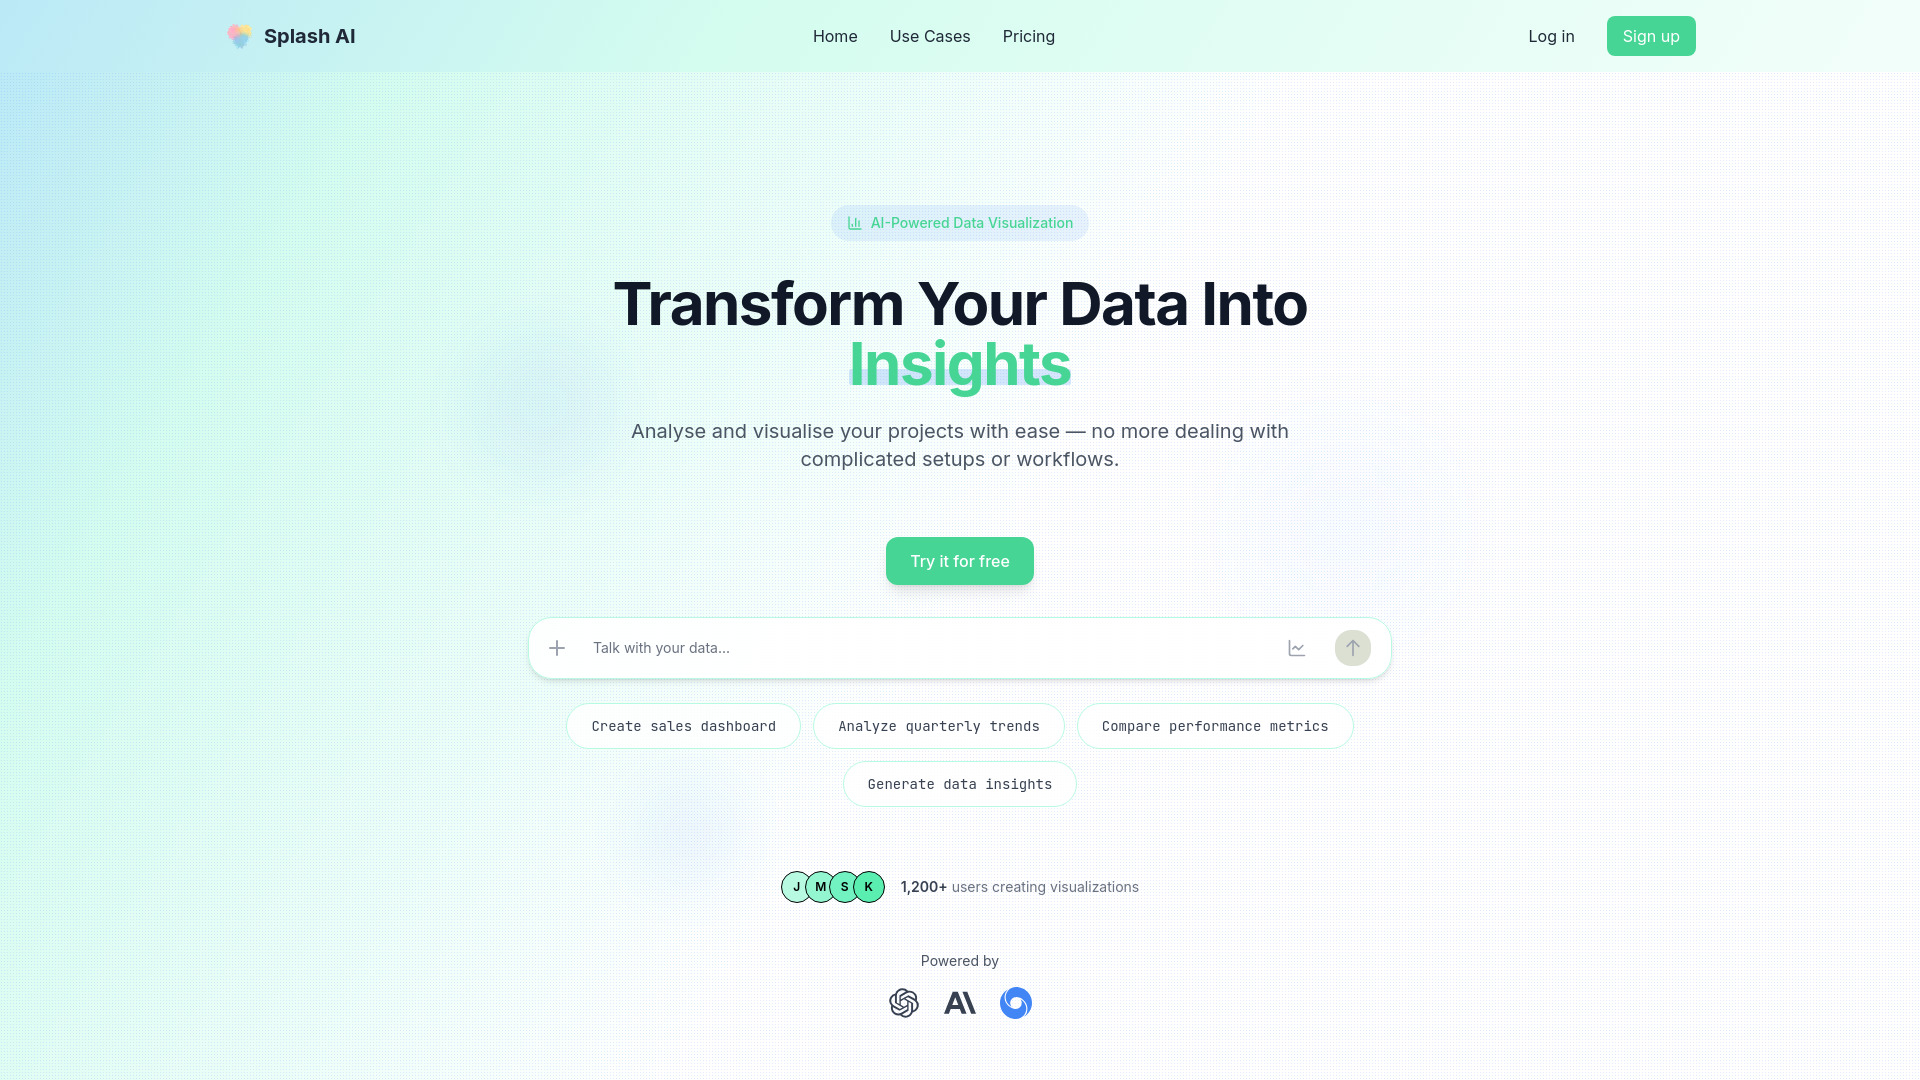
What is Splash AI?
Splash AI is a no-code analytics platform designed to help people turn raw information into understandable insights, useful reports, and engaging visuals. Instead of requiring users to write Python scripts, SQL queries, or complex formulas, the Splash AI online tool lets them work with data through plain-language instructions. Users can upload a file, ask a question, and receive an analysis tailored to their request. The platform combines artificial intelligence, natural language understanding, automated data preparation, and visualization capabilities in one streamlined workspace. From identifying sales trends and exploring customer behavior to creating forecasts and detecting unusual activity, Splash AI helps make advanced analytics more approachable. Its ability to generate visual outputs and reproducible notebooks also makes it useful for both nontechnical professionals and experienced data teams.
How to Use Splash AI
Using Splash AI begins with importing the information you want to examine. The platform accepts common file types such as CSV, JSON, Parquet, Excel, TSV, and TXT, as well as selected image-based sources. After uploading a dataset, users can describe their goal in everyday language. For example, you might ask the Splash AI AI tool to compare monthly revenue, find the products with the highest growth, identify customer segments, or display a trend over time. The system interprets the request, prepares the data, performs the necessary calculations, and presents the result in a clear format.
Once an initial result is available, you can continue the conversation to refine it. Ask for a different chart, filter the results by region, change the date range, or compare two groups. Splash AI can support more detailed workflows, including funnel analysis, cohort exploration, forecasting, anomaly identification, and flow visualizations. This conversational process allows users to move from a broad question to a focused answer without rebuilding an analysis from the beginning. For recurring work, teams can use the resulting outputs as a foundation for reports, presentations, or ongoing performance reviews.
Key Features of Splash AI
- No-Code Analytics: Splash AI removes much of the technical friction associated with data analysis. Users can investigate datasets, calculate metrics, and explore relationships without needing to learn a programming language or construct complicated formulas.
- Conversational Data Queries: The platform understands natural-language questions and converts them into analytical tasks. A request such as “compare customer retention across acquisition channels” can become a structured analysis with relevant calculations and supporting visuals.
- Automated Data Preparation: Splash AI can assist with common preparation tasks, including organizing columns, recognizing data types, highlighting incomplete values, and preparing information for analysis. This helps users spend more time interpreting results and less time on repetitive setup.
- Instant Visuals and Dashboards: The system can recommend and create charts suited to the data, including bar charts, line graphs, scatter plots, heatmaps, funnel charts, and other interactive visual formats. These visuals make trends and comparisons easier to communicate.
- Jupyter Notebook Creation: Analyses can be accompanied by generated Jupyter notebooks. This gives technical users an opportunity to review the process, reproduce the results, adjust the code, and extend the work for more specialized projects.
- Broad File Compatibility: Splash AI supports a variety of structured formats and can work with certain image-based inputs. Users can begin with the files they already have instead of converting every source into a single format first.
Why Choose Splash AI?
Splash AI is built for organizations that want faster access to information without limiting analysis to a small group of specialists. Traditional analytics projects can involve lengthy requests, technical backlogs, and multiple rounds of communication between business teams and data professionals. With Splash AI, people who understand the business context can investigate questions directly and receive useful results in a shorter timeframe. This makes it easier to test ideas, monitor performance, and make decisions while the information is still relevant.
Another advantage is the combination of accessibility and analytical depth. Beginners can use simple prompts to create reports and charts, while experienced analysts can inspect generated notebooks and develop the results further. The platform can support use cases ranging from one-time exploration to repeated business reporting. By bringing data preparation, AI-assisted analysis, and visual storytelling into the same environment, Splash AI helps teams reduce manual effort and create a more collaborative data workflow. As with any automated analytics system, users should review outputs and confirm important conclusions against reliable source data before making high-impact decisions.
Use Cases and Applications
Sales Performance: Sales managers can analyze revenue by representative, territory, product, or time period. Splash AI can help reveal changes in win rates, identify high-value opportunities, compare quota performance, and create forecasts based on historical activity. Visual summaries make it easier to discuss results during pipeline and performance meetings.
Marketing Measurement: Marketing teams can bring campaign, channel, and conversion data together to evaluate performance. They may use Splash AI to compare acquisition costs, review click or conversion trends, examine customer cohorts, and explore how marketing investment relates to revenue. These insights can guide budget allocation and campaign optimization.
Finance and Operations: Finance professionals can use the platform to review expenses, revenue, margins, cash movement, and budget variances. Operations teams can investigate order volumes, fulfillment times, inventory movement, and service-level metrics. Automated charts and summaries help turn detailed records into information that stakeholders can understand quickly.
Customer and Product Analytics: Product teams can study feature adoption, user activity, retention, and conversion paths. Funnel visuals can show where users leave a journey, while cohort analysis can reveal how behavior changes after signup or purchase. These findings can support product improvements and more targeted customer experiences.
Healthcare and Research: Researchers and healthcare organizations may use Splash AI to explore de-identified datasets, examine treatment outcomes, monitor measurements, and spot unusual values. It can accelerate exploratory work and help teams communicate findings visually. Sensitive information should always be handled according to applicable privacy, security, and regulatory requirements.