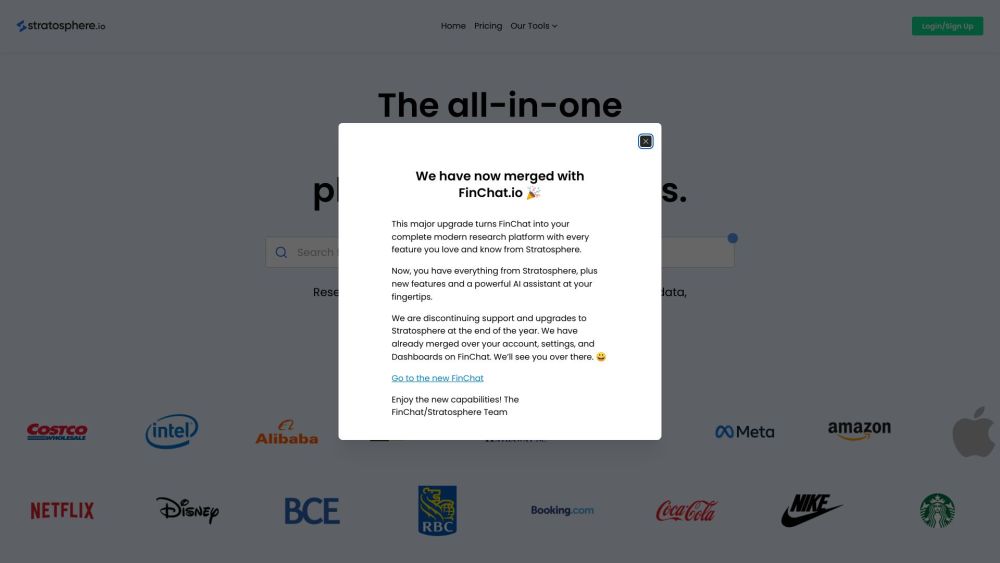
Stratosphere.io: Research Companies 90x Faster with 35 Years of Data
Research public companies 90x faster with Stratosphere.io's 35 years of financial data and KPIs. Get insights instantly for smarter decisions.


What is Stratosphere.io?
Accelerate your research on public companies by 90x with access to up to 35 years of comprehensive financial data and detailed company-specific KPIs.
How to use Stratosphere.io?
Stratosphere.io's Core Features
Extensive financial data spanning up to 35 years
Detailed KPIs and segment information
Personalizable dashboards
Advanced charting and data visualization
Comprehensive research terminal for investors
Analyst ratings and estimates
Stratosphere.io's Use Cases
Detailed company research
Monitoring financial performance and key metrics
Examining industry trends
Comparative analysis of company metrics
Tracking super investors and hedge fund communications
Stratosphere.io Support & Contact Information
For more details, visit the contact us page.
Stratosphere.io Company Information
Company Name: Stratosphere Technology Inc.
Stratosphere.io Login
Login here: https://finchat.io/pricing/
Stratosphere.io Sign up
Register here: https://finchat.io/pricing/
Stratosphere.io Pricing
Find pricing details: https://finchat.io/pricing/
Stratosphere.io on LinkedIn
Follow us: https://www.linkedin.com/company/finchat-io/
Stratosphere.io on Twitter
Stay updated: https://twitter.com/finchat_io
FAQ from Stratosphere.io
What is Stratosphere.io?
It's a platform designed to enhance research efficiency by providing up to 35 years of financial data and company-specific KPIs.
How to use Stratosphere.io?
Sign up for free and start using the platform to research companies, track KPIs, analyze financials, and create custom dashboards.
What resources are available on Stratosphere.io?
Access to financial data, KPIs, analyst estimates, investment tools, and resources like super investors and hedge fund letters.
How can I use Stratosphere.io for my investment analysis?
Utilize Stratosphere.io for in-depth research, performance tracking, industry trend analysis, metric comparison, and following investment insights from top investors.
Is Stratosphere.io free to use?
Yes, you can access basic features for free, with premium options available at a cost.
Can I customize the data and visualizations on Stratosphere.io?
Absolutely, Stratosphere.io offers customizable dashboards, visualizations, and metrics to suit your research needs.