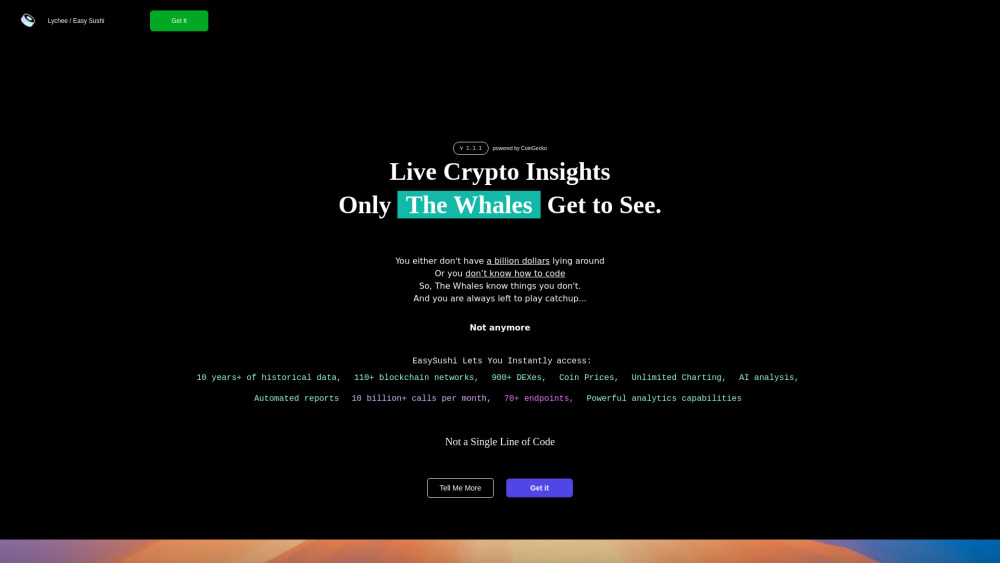
EasySushi: Live Crypto Insights, No Coding Required, Simple & Fast
EasySushi: Live Crypto Insights, No Coding Required – Access real-time crypto insights effortlessly. No coding skills needed, just data-driven decisions.


Discover EasySushi
EasySushi is your go-to platform for live cryptocurrency insights, designed for users who want quick and efficient access to the crypto market without needing any coding experience. It offers a comprehensive suite of tools, including access to a decade's worth of historical data, support for 110+ blockchain networks, analysis across 900+ DEXes, and much more, all within an intuitive and user-friendly interface.
Getting Started with EasySushi
Key Features of EasySushi
10+ years of comprehensive historical data
Support for over 110 blockchain networks
Analysis across 900+ DEXes
Unlimited charting capabilities
Advanced AI-driven insights
Automated, customizable reporting
Why Choose EasySushi?
Effortlessly access real-time crypto insights without coding
Seamlessly analyze data across multiple networks and DEXes
EasySushi Pricing
For detailed pricing information, visit: https://www.lych3e.com/sushi#getIt
Frequently Asked Questions about EasySushi
What is EasySushi?
EasySushi is a platform designed to provide live crypto insights without requiring any coding skills. It grants access to a wide range of features, including historical data, blockchain networks, DEX analysis, unlimited charting, AI insights, and automated reports.
How do I use EasySushi?
Using EasySushi is simple—just head to the website and start exploring the various crypto market insights on offer. The platform is user-friendly and doesn’t require any coding knowledge.
Do I need coding skills to use EasySushi?
No, EasySushi is built for users without coding experience, allowing them to easily access and analyze live crypto data, historical trends, and more.
What are the main features of EasySushi?
EasySushi provides access to over 10 years of historical data, 110+ blockchain networks, 900+ DEXes, as well as unlimited charting, AI analysis, and automated reporting tools.